


I audited 20 ecommerce stores for retention in the last month. Different products, different sizes, most of them between $300K and $900K a year and buying most of their traffic.
Every one of them could tell me their retention rate. Not one could tell me how fast their customers come back after the first order.
That is the whole problem in two sentences. The number they watched was the wrong one, and the number that decides their year was sitting in their own order export, unread.
If you run a store and want one count like this every day, subscribe below. Now the detail.
What every store had, and what none had
Each store had a retention rate on a dashboard, usually somewhere between 20 and 35 percent. Most owners had a benchmark in their head to compare it to, pulled from a blog post. Some felt behind. Some felt fine.
None of them had the time window. Retention is a count of people who came back inside a stretch of time. Without the stretch, the count means nothing. Thirty percent of buyers back in a month is a great store. Thirty percent back over five years is a store in trouble. The dashboards did not say which, and the owners had not asked.
And none of them had looked at the days right after the first order. In the audits, the emails between “order placed” and “delivered” were tracking notices. Four emails, four courier links. Then silence until a sale.
So I read what they were reading
I wanted to know where the benchmark in their heads came from. I searched the question the way a store owner would, “what is a good customer retention rate for an ecommerce store”, and opened the pages that came up first. Eleven pages, all opened on October 14, 2026. Nine gave a number.
The figures, lowest to highest: 18.8%, 25%, 27.4%, 28.2%, 30%, 30% to 38%, 31%, 38%. Two pages gave 25%, one repeating the other’s study, so it appears once.
Six of the nine never said over how many months they measured. Three gave a window: 12 months, 12 months, 365 days.
At least five of the nine numbers came from another company’s page. Shopify’s 27.4% is Bluecore’s number. A loyalty app’s 25% is credited to Little Stream Software. Two pages quote Opensend. Page A quotes page B, page C quotes page A, and three years later nobody remembers that the first page sold a loyalty tool.
One page still had a note to its own editor in the live text, next to its 30% to 38% figure: “editor to verify before publishing.” The page published. The editor never came.
Sources, so you can check me: https://bsandco.us/blog-post/repeat-purchase-rate-benchmarks, https://www.shopify.com/blog/average-customer-retention-rate-by-industry, https://flowium.com/blog/customer-retention-rate/, https://www.rivo.io/blog/shopify-customer-retention-benchmarks, https://inbeat.agency/blog/customer-retention-statistics, https://joy.so/blog/customer-retention-benchmarks/, https://www.littlestreamsoftware.com/articles/2024-data-study/, https://focus-digital.co/average-customer-retention-rate-by-industry/
So the number every owner was measuring themselves against was a number with no window, copied from a page that sells software. The owners who felt behind and the owners who felt fine were both reacting to a different tab.
The one page that answered the real question
One of the nine did the work. An agency tracked 156,110 customers across several online brands for 365 days. Only 18.8% placed a second order inside that year.
Then the useful part. Of the customers who did come back, 50.3% did it within 30 days and 76.4% within 90. The median time to the second order sat between 15 and 35 days.
Read that slowly. Half of everyone who will ever come back in a year comes back inside a month. Three in four inside three months. After day 90 the door is mostly shut.
I call this the second-order window. The yearly retention rate gets reported in month twelve, but it was decided in the first ninety days. By the time it shows up in a report, the buyers it counts made up their minds months earlier.
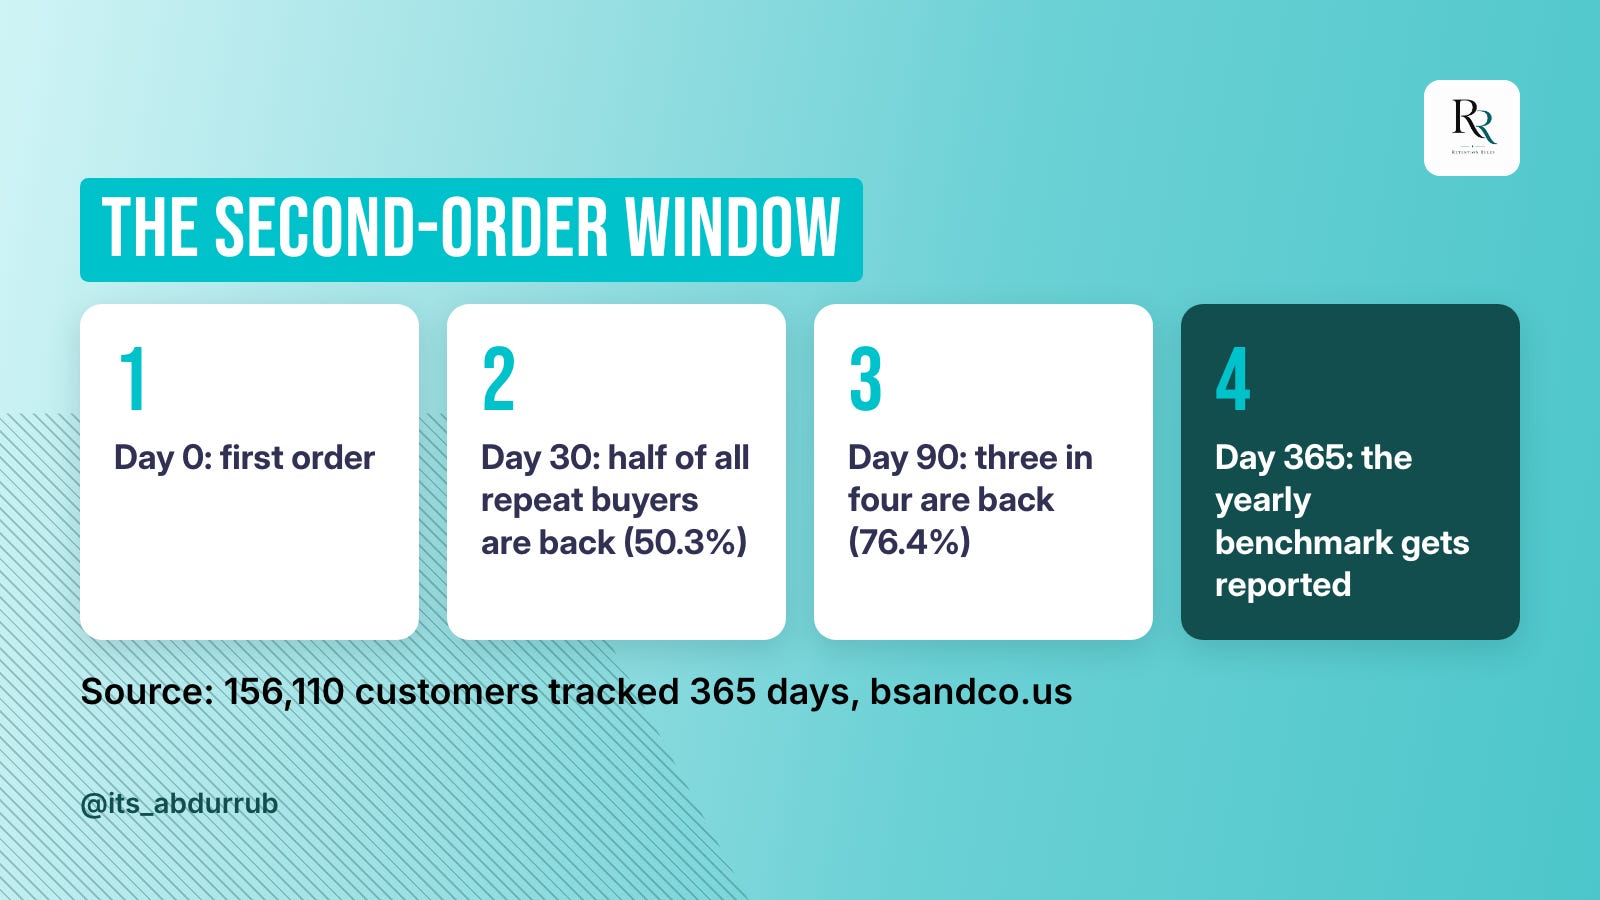
Now put that next to what I found in the audits. The first 90 days are where the second order is won or lost, and every store I looked at was spending those days on courier links.
Why the category changes the clock
A store that sells dog food and a store that sells sofas are not running the same race. One customer runs out every month. The other may not need a new one for years.
The pages show it. Decile’s figures, as quoted on a loyalty app’s blog, put retention at 23% for food and beverage and 12% for home goods. Another guide lists home and furniture at 14.7% and pet supplies at 30% or more.
The mechanism is how often the product runs out. Coffee, supplements and pet food empty on their own schedule and bring the buyer back. A lamp does not. An average across both tells a lamp store nothing about itself, and that is what most benchmark pages are: an average across both.
Where this stops
Twenty audits in one month is my sample, not the industry. The nine pages all came from companies that sell software, data or agency work, including the one I trust most. The 30-day and 90-day timing comes from one agency’s own client brands.
The second-order window is shortest for things that run out. A furniture or mattress brand runs on a longer clock, and pushing a second order in 30 days there only buys discounts. A buyer who came for the discount leaves when the discount ends; that is Rule 9 in my 30 Rules of Customer Retention.
And none of this helps a store with no list and no proven product. The window only matters once there are buyers to bring back.
What I pull in every audit, and what you can pull on Monday
Here is the order, the same one I use.
Take every first-time buyer from 12 to 15 months ago, so each one had a full year to come back.
Count the share who placed a second order inside that year. That is your retention rate, with a window, in your own data.
Of the buyers who came back, count how many did it within 30 days and within 90. Set that next to 50.3% and 76.4%.
Open every email and text a first-time buyer gets in those 30 days, in order. Write down what each one asks for. If the answer is “nothing, it is a tracking link”, you have found the leak.
Fix the first 30 days before you touch the yearly number.
One hour with an export and a spreadsheet. Then you have a benchmark with a window and a source you can name: your own store.
If this was useful, subscribe. Tomorrow’s essay is another count.
Run an online store and want the first 90 days fixed for you: flows.retentionrules.com
Run a coaching or software business: book a call at abdurrub.com